
Most HR teams already own the data they need. It sits in the HRIS, the applicant tracking system and a payroll export, and nobody has joined the three. HR analytics software does that joining, then turns headcount, turnover and pay records into charts you can act on.
This guide covers what to measure, how to start with a spreadsheet, and where five named tools fit. For general HRIS shopping, see our broader HR software roundup. Here the question is narrower: can this tool answer a question your CEO will actually ask?
What HR analytics software actually does
Picture a founder asking in a Monday meeting why three engineers left this quarter. You open the HRIS and find a headcount list. It cannot tell you tenure at exit, manager, pay band or last review score.

Analytics software links those fields. It pulls records from the HRIS, ATS, payroll and sometimes finance. It then lets you slice them by team, tenure or location without rebuilding a spreadsheet each time.
Three layers matter:
- Reporting: fixed dashboards for headcount, turnover and time-to-hire.
- Analysis: filters and cohort comparisons you build yourself.
- Planning: scenarios such as a hiring freeze or a reorg.
Most small-company tools stop at reporting. That is often enough. Know which layer you need before you read a vendor deck.
Metrics worth tracking first
A people-ops manager at a 60-person company once told her board that attrition was “fine.” The board asked “fine compared to what?” She had no answer. Start with a short list and define each metric in writing.
Copy this definition block into your reporting doc:
Voluntary turnover rate: employees who resigned in the period ÷ average headcount in the period × 100. Exclude layoffs, end of contract and retirements. Report quarterly and rolling 12 months.
Time to hire: days from job posting live to offer accepted. Report the median, not the mean.
Regretted loss: resignations of people rated meeting expectations or above in their last review.
Four metrics are enough at the start: headcount by team, voluntary turnover, time to hire and regretted loss. Add engagement or pay-equity views later.
One caution on benchmarks. Quote them only with their source, year and sector. A 2024 figure for US tech firms says little about a 40-person UK retailer. If a vendor shows a benchmark, ask for the sample.
Start with a spreadsheet before you buy
Before you pay for anything, test whether your data is clean enough to analyze. Software cannot fix inconsistent job titles or missing termination reasons.
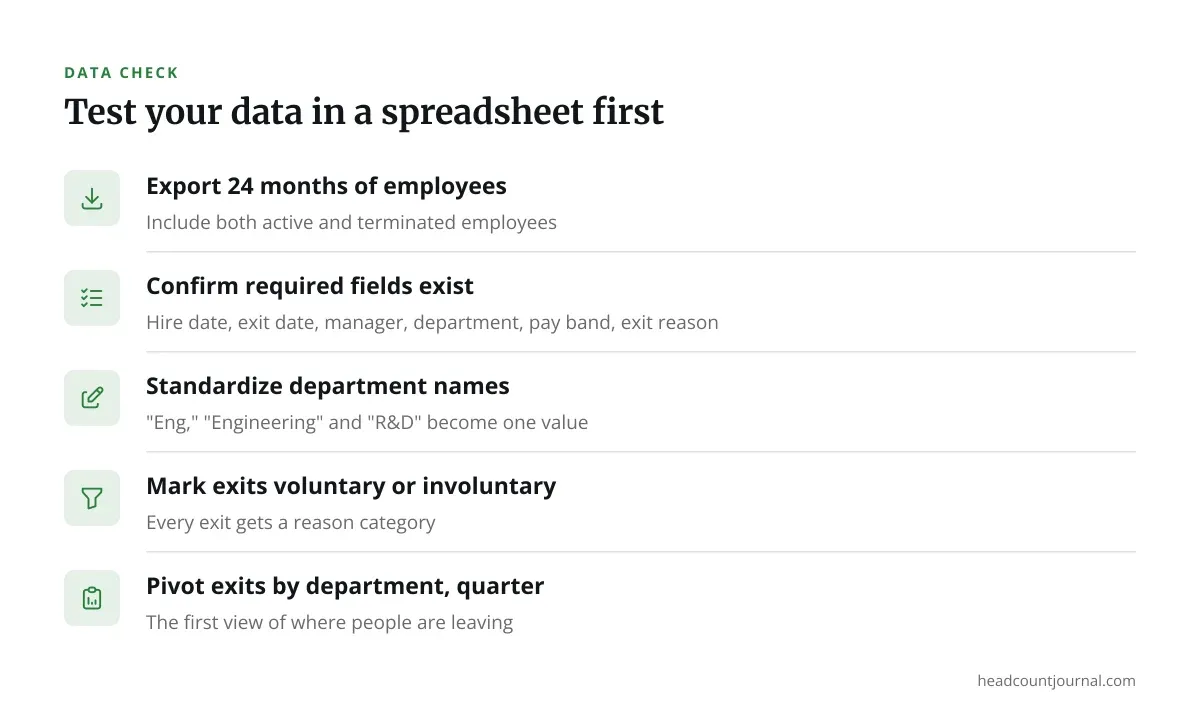
Run this check on a spreadsheet export:
- Export every employee, active and terminated, from the last 24 months.
- Confirm each row has hire date, exit date, manager, department, pay band and exit reason.
- Standardize department names. “Eng,” “Engineering” and “R&D” must become one value.
- Mark the exit reason as voluntary or involuntary.
- Build a pivot table of exits by department and quarter.
If step two shows more than a fifth of rows with gaps, fix the process first. Tools like BambooHR enforce required fields, which helps, but only if managers complete them.
Many companies find a clean spreadsheet answers their first five questions. That is a fine outcome. It tells you the real need is better data entry, not a new platform.
Five HR analytics tools compared
The tools below are quite different in depth and price. Ranking them as one league table would mislead, so the comparison runs by who each tool suits.
| Tool | Price | Best for | Fits badly |
|---|---|---|---|
| BambooHR | From $10.25 USD/employee/mo (Core), for companies with more than 25 employees | Small and mid-sized businesses wanting built-in reporting | Teams needing advanced workforce modeling |
| ChartHop | Pricing on request | Growing companies needing org charts and compensation analytics | Very small teams with simple needs |
| Visier | Pricing on request | Large enterprises with a people analytics team | Companies with messy or sparse data |
| Zoho People | Pricing on request | Small businesses already in the Zoho ecosystem | Teams wanting a polished interface |
| Lattice | Pricing on request | Mid-sized companies focused on performance and engagement | Teams needing payroll or deep global compliance |
BambooHR
BambooHR publishes its price list, which is rare in this category. Companies with 25 employees or fewer pay a flat monthly rate: Core is $250 USD/mo, Pro is $425 USD/mo and Elite is $650 USD/mo. Above 25 employees, Core is $10.25 USD/employee/mo, Pro is $17.50 USD/employee/mo and Elite is $25 USD/employee/mo.
Applicant tracking is billed as an add-on, per a third-party pricing guide. It fits badly if you want scenario planning or predictive models. Expect solid standard reports, not a research lab.
ChartHop and Visier
ChartHop centers on org charts, headcount planning and compensation analytics. Modules are sold separately, so your final bill depends on the mix. Pricing is on request. It fits badly if you only need a headcount report.
Visier ingests HRIS, ATS, payroll and finance data, with prebuilt benchmarks and scenario planning, per an hrpresso review. Pricing is on request and quote-based. It fits badly if you have no analyst. Without one, the depth sits unused.
Zoho People and Lattice
Zoho People has a free plan limited to 5 users, plus four paid tiers. Third-party sources describe it as one of the cheapest options with a steeper learning curve. The Essential HR tier excludes performance management and recruiting, per TechRepublic. Pricing is on request. It fits badly if your managers expect a modern interface.
Lattice covers performance, engagement and an HRIS called Foundations. Pricing is on request. Its HRIS lacks payroll processing, benefits administration and deep global compliance, per a theaiagentindex review. It fits badly if you want one system for payroll and analytics.
How to run a pilot that gives a straight answer
A demo shows the vendor’s data, not yours. A pilot shows whether the tool handles your messy reality.
Ask for a trial with a real export. Then give the vendor three questions your leadership has asked in the past year. For example:
- “Which teams lost the most regretted talent last year?”
- “How long did engineering roles stay open, by quarter?”
- “Does pay band predict exit in sales?”
Score each tool on a simple sheet:
Question answered without custom work? (Y/N)
Time to answer (minutes):
Could a manager repeat it without help? (Y/N)
Data issues the tool exposed:
Set a pass mark before you start, such as two of three answered by a non-analyst in under an hour. Write it down so enthusiasm after a good demo does not move it.
Ask each vendor three further questions. Who owns data integrations during setup? What happens to your data if you cancel? What is the realistic time to first useful dashboard? Get answers in writing, and have your IT or privacy lead review them.
Privacy and legal guardrails for people data
Analytics makes sensitive data easy to slice. Slice it carelessly and you create risk.
Set a minimum group size before any chart displays. Many teams use five or more people per cell, so a pay or exit view cannot identify an individual. Restrict access by role. Managers should see their own team, not the company’s pay data.
Employment and privacy rules differ by state and by country. Data-protection law in the EU and UK, for example, treats employee data differently from US practice, and some US states add their own notice and consent rules. Confirm your setup with qualified counsel before you analyze pay, health or performance data. Nothing here is legal advice.
Write a one-page policy in plain wording. Copy and adapt this:
“We use people data to understand hiring, retention and pay fairness at group level. We do not use it to make automated decisions about individuals. Access is limited by role. Reports show groups of five or more. Employees may ask what data we hold about them.”
Share it with staff before launch. Silence about analytics breeds distrust faster than the analytics themselves.
Turning the numbers into a decision
A dashboard is not a decision. Pick one metric, assign one owner and set a review date.
Say your quarterly report shows voluntary turnover in customer support at a high rate. The next step is not another chart. It is five exit conversations and a look at manager, pay band and schedule for that team. Analytics points you to the room. People tell you what is in it.
For budget, start small. A published-price tool like BambooHR lets you cost a pilot before talking to sales. Where pricing is on request, ask for a written quote tied to your headcount and the specific modules you need. Compare it against the cost of one analyst day a month using a spreadsheet.
If your data is clean, your questions are specific and someone owns the output, most of the tools above will serve you. If not, fix those three things first. No platform will do it for you.
Pricing verified 2026-10-20. Check the vendor site for the latest.
Frequently asked questions
What is the difference between HR analytics software and an HRIS?
An HRIS stores employee records and handles tasks such as time off and onboarding. HR analytics software analyzes that data for patterns in turnover, hiring and pay. Some HRIS products, like BambooHR, include reporting. Others, like Visier, sit on top of your HR systems.
Do small companies need HR analytics software?
Often not at first. Under 50 employees, a clean spreadsheet and a pivot table usually answer the main questions. Buy software when manual reporting eats hours each month or when leadership asks questions the spreadsheet cannot answer.
How much does HR analytics software cost?
It varies widely. BambooHR publishes tiers starting at $10.25 USD/employee/mo (Core) for companies with more than 25 employees. ChartHop, Visier, Zoho People and Lattice list pricing on request, so get written quotes based on your headcount and modules.
Can HR analytics software predict who will quit?
Some enterprise tools offer predictive features, but they need years of clean data to be reliable. Treat predictions as prompts for conversations, not verdicts on individuals. Employment and privacy rules on automated decisions differ by state and country, so confirm with counsel.
How long does it take to get useful reports?
With clean data and a simple tool, a first dashboard can take days. Messy data stretches that to weeks or months. Ask vendors for a realistic timeline in writing and test it with your own export during the pilot.