
Employee engagement metrics should warn you before people leave. Your quarterly dashboard says engagement is up three points. Meanwhile, two of your best people just resigned, and nobody saw it coming.
That gap is the usual problem with employee engagement metrics. Most teams track what is easy to count, not what predicts behavior. This guide shows which numbers earn their place, how to read them together, and how to turn them into action.
Start With Employee Engagement Metrics That Predict Exits
Picture a people-ops manager at a 120-person company. She reports a strong survey participation rate and calls it a win. Three months later, the engineering team loses four people.
Participation measures compliance, not commitment. Treat it as a health check on the survey itself, nothing more.
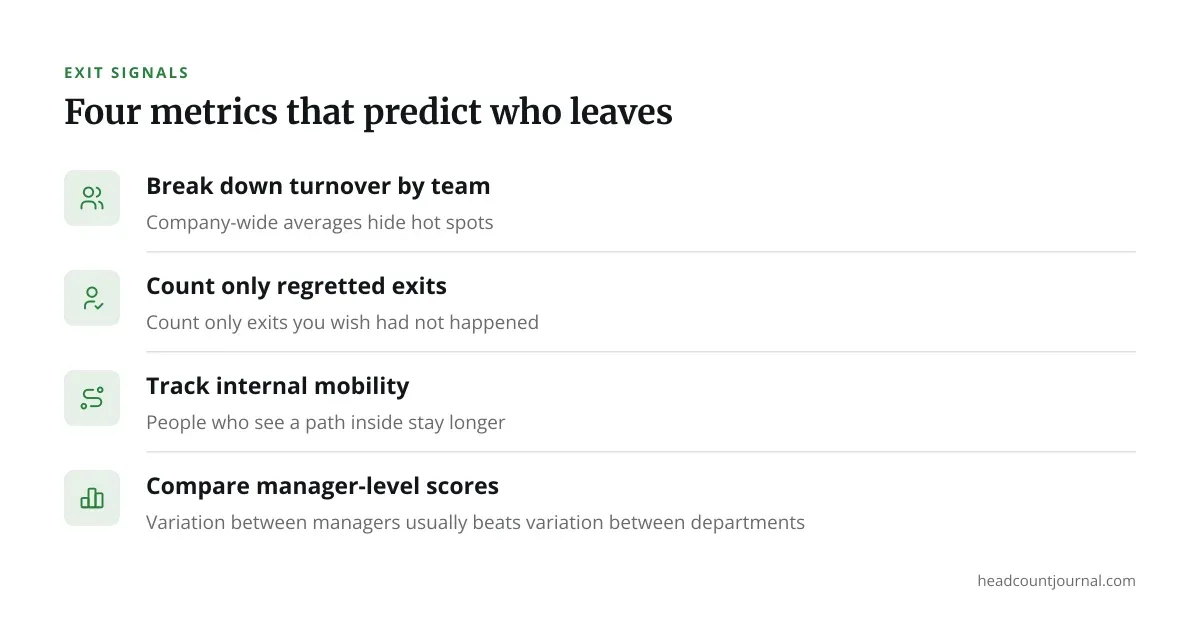
The metrics that tend to predict trouble are different:
- Voluntary turnover by team and tenure band. Company-wide averages hide hot spots.
- Regretted attrition. Count only exits you wish had not happened.
- Internal mobility rate. People who see a path inside stay longer.
- Manager-level survey scores. Variation between managers usually beats variation between departments.
Pull these four into one view, split by team. A flat company average with one team at triple the exit rate is the story you are looking for.
Survey Employee Engagement Metrics Worth Keeping
A founder once told me, in effect, “We ask forty questions and act on none.” You do not need forty. A few well-worded items, asked on a steady rhythm, beat a long annual form.
Keep these survey measures:
- Employee Net Promoter Score (eNPS). One question on whether people would recommend the company as a place to work, scored 0 to 10.
- Manager support. Does your manager help you do your best work?
- Role clarity. Do you know what good looks like in your job?
- Intent to stay. Do you see yourself here in twelve months?
Copy this phrasing into your next pulse:
“On a scale of 0 to 10, how likely are you to recommend working here to a friend? What is the main reason for your score?”
The free-text follow-up matters more than the number. Read every comment before you chart anything. If you are still choosing a format, our breakdown of what works in an engagement survey covers question design in more detail.
Leading vs. Lagging Indicators
Lagging indicators
Turnover, absenteeism, and exit-interview themes tell you what already happened. They are reliable, but they arrive late. By the time regretted attrition rises, the cause is months old.
Use lagging metrics to confirm patterns, not to steer. If a team’s exits spike in March, look back at its January pulse results and its manager changes.
Leading indicators
Pulse scores, one-on-one frequency, recognition given and received, and time-to-first-feedback for new hires move earlier. They are noisier, but they give you time to act.
A practical test: for each metric, ask what you would do differently if it moved. If the answer is “nothing,” drop it. Pair each leading indicator with a lagging one so you can check whether your early signals earn their keep. Six months of paired data will tell you which pulse questions actually forecast exits in your company.
Reading the Numbers Without Fooling Yourself
You get a 7.4 on manager support. Is that good? Without context, you cannot say.
Three habits keep you honest:
- Compare against yourself first. Your own trend over four quarters is more useful than a stranger’s average.
- Respect small samples. A team of six with one unhappy person swings a score hard. Set a minimum group size, commonly five or more, before you report team-level results. This also protects anonymity.
- Look at distribution, not just the mean. An average of 7 can mean everyone is lukewarm, or half your team is thrilled and half is miserable.
External benchmarks can help, but check the fine print. Gallup’s State of the Global Workplace reports track engagement across regions and publish new figures yearly. Always note the year, the country or region, and the sample before you quote a number to leadership. A US figure from one year says little about a Pakistani logistics firm or a UK charity.
Tools for Tracking Employee Engagement Metrics
Software helps once you know which numbers matter. Pricing below comes from each vendor’s public pricing pages at the time of writing and can change, so confirm current quotes before you buy.
| Tool | Published pricing | Fits well | Fits badly |
|---|---|---|---|
| Culture Amp | Quote-based | Mid-size to large firms wanting benchmarks and analytics | Teams under 50 who need something light |
| Lattice | Per-seat tiers, billed per employee per month | Companies tying engagement to reviews and goals | Firms that only want a quick pulse survey |
| 15Five | Per-seat monthly pricing | Manager-led check-ins and weekly rhythms | Organizations with many frontline staff without desk access |
| Officevibe | Per-user monthly pricing, now under Workleap | Small teams wanting simple pulses | Large enterprises needing deep custom analytics |
| Google Forms | Free with a Google account | Founders testing a first pulse | Anyone needing trend tracking or anonymity controls at scale |
Per-employee rates vary by plan and company size, and several vendors only publish them after a sales call. Ask each one for a written per-employee quote covering the full headcount, including part-timers. For a wider look at what changes behavior rather than just collecting data, see engagement tools that actually change behavior.
Turning Metrics Into Action
A director sees that manager support is the lowest-scoring item in operations. She does nothing for two months because the report “needs review.” Meanwhile, the scores harden into resentment.
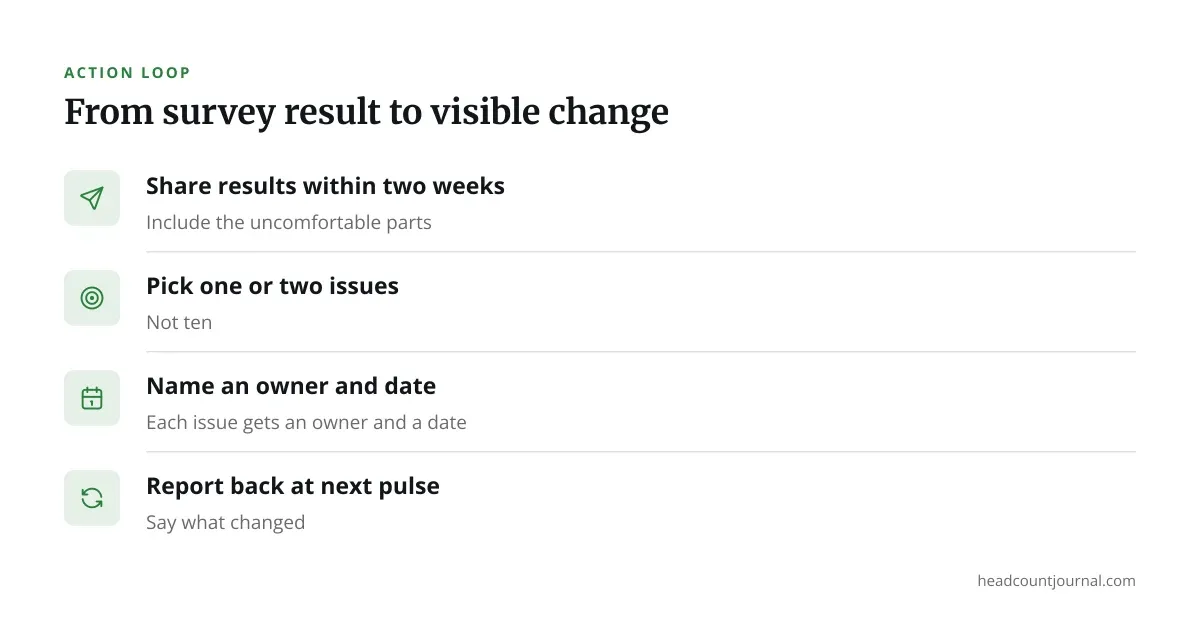
Speed matters more than polish. Use this loop:
- Share the result within two weeks of closing the survey, including the uncomfortable parts.
- Pick one or two issues to address. Not ten.
- Name an owner and a date for each.
- Report back at the next pulse on what changed.
Here is wording you can adapt for a team message:
“You told us role clarity is our lowest score. Over the next six weeks, each manager will hold one session to write down what success looks like for every role. We will check progress in the next pulse.”
Closing the loop is the metric behind the metrics. If people see no response, response rates fall and your data quietly stops meaning anything. Ideas for what to try next live in our 2026 engagement ideas.
A Practical Starter Set of Employee Engagement Metrics
You do not need a dashboard with thirty tiles. Start small, run it for two quarters, then adjust.
A workable first set: voluntary turnover by team, regretted attrition, eNPS, manager support, and intent to stay. Review them monthly with your leadership team, always split by team and tenure. Add measures only when a specific question demands one.
Be careful with anything touching privacy or employment law. Rules on employee surveys, data retention, and monitoring differ by state and country, so confirm your approach with qualified counsel before you collect or store individual-level data. Nothing here is legal advice.
The goal is not a perfect score. It is an honest early warning, followed by a visible response. For the bigger picture of how measurement fits into a plan, read our guide to engagement strategies that hold up under pressure.
Frequently asked questions
What are the most important employee engagement metrics to track?
Start with voluntary turnover by team, regretted attrition, eNPS, manager support, and intent to stay. Together they cover outcomes and early signals. Add others only when a clear question requires them.
How often should you measure employee engagement?
Many teams run a short pulse monthly or quarterly, plus one deeper survey each year. Pick a rhythm you can actually act on. A survey you cannot respond to within weeks does more harm than none.
Is eNPS a reliable engagement measure?
It is a quick, comparable signal, but it is not diagnostic on its own. A score tells you that something changed, not why. Always pair it with an open-text question and read the comments.
What is a good engagement score?
There is no universal answer. Your own trend over several quarters is the most useful benchmark. If you quote an external figure, name the source, year, and country or sector it covers, since results differ widely across them.
Can you legally collect engagement survey data?
Generally yes, but rules on privacy, consent, and data retention differ by state and country. Confirm your approach with employment counsel before collecting individual-level or sensitive data.